Close
Select a product line:
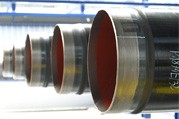
Anticorrosive coatings
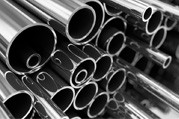
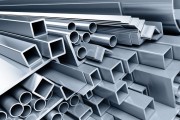
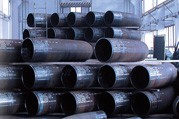
Steel pipes
Metallurgical products
General Terms of Sale
Selected financial data A A A
Selected financial data of Izostal S.A.
(PLN thousand)
| 2025 | 2024 | 2023 | 2022 | 2021 | |
|---|---|---|---|---|---|
| Net revenues from sale of products, goods and materials | 1 125 037 | 678 304 | 661 394 | 1 044 671 | 686 432 |
| Operating profit (loss) | 30 386 | 21 067 | 28 409 | 25 873 | 14 395 |
| Gross profit (loss) | 15 476 | 12 412 | 12 549 | 19 945 | 18 498 |
| Net profit (loss) | 12 160 | 9 576 | 10 067 | 15 867 | 14 568 |
| Cash flow - operating activity | 93 740 | -62 906 | 111 049 | -46 711 | -4 581 |
| Cash flow - investment activity | -11 935 | -2 689 | -7 737 | -17 744 | -10 629 |
| Cash flow - financial activity | -98 500 | 87 252 | -106 741 | 46 588 | 38 733 |
| Change in cash and cash equivalents | -16 695 | 21 657 | -3 429 | -17 867 | 23 523 |
| Total assets | 500 935 | 731 366 | 468 447 | 649 810 | 674 672 |
| Long-term liabilities | 25 957 | 29 772 | 32 497 | 31 700 | 28 347 |
| Short-term liabilities | 224 541 | 460 348 | 201 308 | 389 556 | 429 747 |
| Share capital | 250 437 | 241 246 | 234 642 | 228 554 | 216 578 |
| Number of shares | 32 744 000 | 32 744 000 | 32 744 000 | 32 744 000 | 32 744 000 |
| Profit (loss) per one ordinary share (PLN) | 0,37 | 0,29 | 0,31 | 0,48 | 0,44 |
| Diluted number of shares | 32 744 000 | 32 744 000 | 32 744 000 | 32 744 000 | 32 744 000 |
| Diluted profit (loss) per one ordinary share (PLN) | 0,37 | 0,29 | 0,31 | 0,48 | 0,44 |
Files to download
Selected financial data of Izostal S.A. Capital Group
(PLN thousand)
| 2025 | 2024 | 2023 | 2022 | 2021 | |
|---|---|---|---|---|---|
| Net revenues from sale of products, goods and materials | 1 233 514 | 771 645 | 751 037 | 1 171 632 | 795 889 |
| Operating profit (loss) | 31 225 | 20 614 | 31 068 | 32 471 | 18 759 |
| Gross profit (loss) | 16 262 | 13 040 | 14 928 | 28 248 | 23 500 |
| Net profit (loss) | 12 793 | 10 139 | 11 935 | 22 484 | 18 551 |
| Cash flow - operating activity | 94 802 | -55 006 | 119 908 | -44 207 | 2 618 |
| Cash flow - investment activity | -12 139 | -4 840 | -11 945 | -21 782 | -9 444 |
| Cash flow - financial activity | -102 182 | 81 885 | -107 055 | 43 005 | 36 091 |
| Change in cash and cash equivalents | -19 519 | 22 039 | 908 | -22 984 | 29 265 |
| Total assets | 543 475 | 775 413 | 511 148 | 693 232 | 720 184 |
| Long-term liabilities | 29 614 | 34 482 | 40 998 | 41 818 | 39 448 |
| Short-term liabilities | 245 149 | 482 023 | 218 409 | 407 605 | 455 530 |
| Share capital | 268 712 | 258 908 | 251 741 | 243 809 | 225 206 |
| Number of shares | 32 744 000 | 32 744 000 | 32 744 000 | 32 744 000 | 32 744 000 |
| Profit (loss) per one ordinary share (PLN) | 0,39 | 0,31 | 0,36 | 0,69 | 0,57 |
| Diluted number of shares | 32 744 000 | 32 744 000 | 32 744 000 | 32 744 000 | 32 744 000 |
| Diluted profit (loss) per one ordinary share (PLN) | 0,39 | 0,31 | 0,36 | 0,69 | 0,57 |
print